|
Driven by precise new satellite measurements and sophisticated
new computer models, a team of NASA researchers is now routinely
producing the first global maps of fine aerosols that distinguish
plumes of human-produced particulate pollution from natural
aerosols.
In the current issue of Nature, atmospheric scientists Yoram
Kaufman, at NASA’s Goddard Space Flight Center, Greenbelt, Md.,
Didier Tanré and Olivier Boucher from CNRS (Centre National de la
Recherche Scientifique) at the University of Lille, reported in a
review paper that these global maps are an important breakthrough in
the science of determining how much aerosol pollution comes from
human activities. Aerosols are tiny solid or liquid particles
suspended in the atmosphere. The authors stated that the next step
is to quantify more precisely the roles human aerosol pollution
plays in Earth’s weather and climate systems.
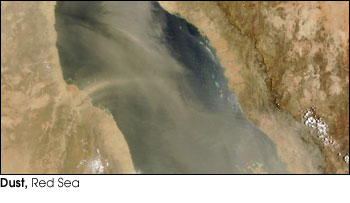
The top scene is a Moderate Resolution Imaging
Spectroradiometer (MODIS) true-color image of a thick plume of
desert dust (brownish pixels) blowing from Northeast Africa eastward
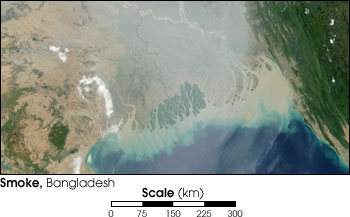
over the Red Sea on July 11, 2002. The bottom scene is a true-color
image of haze and pollution (greyish pixels) blowing southeastward
over Bangladesh and toward the Bay of Bengal on January 14, 2002.
The top image is an example of natural aerosols, while the bottom
image shows human pollution. (Images courtesy Jacques Descloitres,
MODIS Land Rapid Response Team at NASA GSFC)
For more information and high resolution images,
see Dust
Storm over the Red Sea and Thick
Haze Over Northern India.
“Plumes of smoke and regional pollution are distinguished by
their large concentrations of small particles (less than 1
micrometer) downwind of biomass burning sites and urban areas,”
Kaufman said. “These particles are important because, depending upon
the type of particles produced, human pollution can either have a
warming or cooling influence on climate, and they can either
increase or decrease regional rainfall.”
Distinguishing small from large aerosol particles requires good
understanding of how aerosols reflect sunlight at key wavelengths of
the solar spectrum. For the first time ever, the Moderate Resolution
Imaging Spectroradiometer (MODIS) instrument flying aboard NASA’s
Terra and Aqua satellites measures precisely the sunlight reflected
by aerosols back to space every day over almost the entire planet at
wavelengths spanning across the solar spectrum (from 0.41 to 2.2
micrometers).
high resolution images:
Aerosol
Optical Depth (1.3 MB JPEG)
Aerosol
Optical Depth for Print (5.9 MB TIFF)
Aerosol
Radius (1.2 MB JPEG)
Aerosol
Radius for Print (6.9 MB TIFF)
Aerosol plumes comprised of smaller particles (less than 1
micrometer) reflect light at shorter wavelengths (blue light) much
more strongly than plumes comprised of larger particles (greater
than 1 micrometer) which scatter and reflect light roughly equally
at short and long wavelengths (blue, green, red and near-infrared
light). It is this basic understanding that helps scientists use
MODIS data to distinguish human-produced aerosol.
However, there are exceptions to this rule. Kaufman noted that
nature produces small particles too, while humans can generate large
particles by changing land surface cover through agricultural
practices and deforestation. Therefore, scientists need additional
information—such as land use and fire activities, which are also
observed by satellites, as well as information on population and
economic activities—that is fed into advanced new computer aerosol
models.
“Natural aerosols like salt particles from sea spray are
typically widespread over larger areas and not particularly
concentrated downwind of urban areas,” Kaufman observed. “Or, they
are particularly concentrated downwind of obviously natural sources,
such as the streams of dust originating from the Sahara Desert.”
Conversely, aerosols produced by humans are the result of urban
pollution, industrial combustion, or burning vegetation. These
plumes of pollutants appear in punctuated bursts of thick and
concentrated plumes comprised of small particles. Or, they are
concentrated downwind of regions obviously altered by human
activities, such as deforested regions.
The authors find surprisingly good agreement between a new
aerosol model (developed jointly by NASA Goddard and Georgia Tech)
and the measurements now being made by the MODIS sensors. Examining
global satellite images in concert with global-scale models and
globally distributed ground-based measurements gives scientists the
best tools they have ever had to estimate the effects of aerosols on
climate and weather patterns around the world.
The new aerosol measurements collected by the Terra and Aqua
satellites provide dramatic improvements over the measurements made
by previous satellites over the last two decades. Another instrument
on Terra, the Multi-angle Imaging SpectroRadiometer (MISR), observes
aerosols by looking at the radiation reflected and scattered by
aerosols in nine different directions. This multi-angle technique
complements the multi-wavelength approach by NASA. NASA plans to
further expand global aerosol research with the launch of
satellite-based light imaging radars (lidars) that sends bursts of
light to Earth and, like a radar signal, provide a measure of the
altitude and vertical structure of aerosol plumes and clouds.
The Terra and Aqua satellites are part of NASA’s Earth Science
Enterprise, a long-term research effort to understand our home
planet.
For more information, please see the MODIS
website
For more information about POLDER and ADEOS, read Research Satellites for the Atmospheric Sciences,
1978 to the Present
Contact:
Lynn Chandler
Goddard Space Flight
Center, Greenbelt, Md.
Phone: (301) 286-2806
lynn.chandler.1@gsfc.nasa.gov
The article can be downloaded from Nature. |
|
Animations:
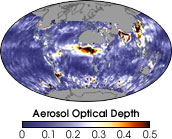
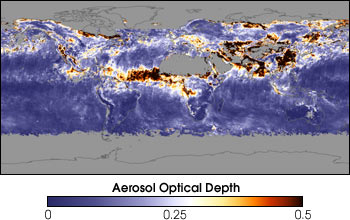
Flying aboard NASA’s Terra and Aqua satellites, the MODIS sensors
measure atmospheric aerosols over almost the entire globe every day.
This movie
shows “aerosol optical depth,” which is a measure of how much
sunlight is prevented from traveling through a column of atmosphere.
Basically, the movie shows where and when aerosol plumes occur—the
darker brown the pattern, the denser the plume of particles and the
less sunlight reaches the surface while more sunlight is absorbed
within the atmosphere or reflected back to space. Grey areas show
where no data were collected, such as over the poles during periods
of darkness, in cloudy areas, and over very bright land surfaces
where MODIS does not make aerosol measurements. (Animation by Reto
Stockli, NASA Earth Observatory, based upon data provided by the
MODIS Atmosphere Science Team, NASA GSFC)
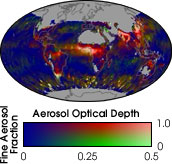
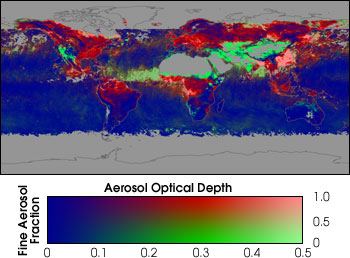
By measuring precisely how much light is reflected at visible and
near-infrared wavelengths, the MODIS sensors can distinguish between
plumes of large aerosol particles (more than 1 micrometer) and small
aerosol particles (less than 1 micrometer). This new information,
along with other data, helps scientists determine which plumes are
human produced and which occur naturally. In this movie,
the green patterns show plumes of large aerosol particles, red shows
plumes of small particles, and the brownish and whitish colors show
where large and small particles are intermingling. Grey areas show
where no data were collected, such as over the poles during periods
of darkness, in cloudy areas, and over very bright land surfaces
(such as snow and ice, or the Sahara Desert) where MODIS does not
make aerosol measurements. (Animation by Reto Stockli, NASA Earth
Observatory, based upon data provided by the MODIS Atmosphere
Science Team, NASA GSFC)
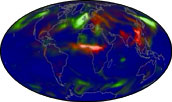
Atmospheric scientists at NASA use the GOCART computer model to
simulate the transport of gases and aerosols through the atmosphere
and around the globe. (GOCART stands for Georgia Tech/Goddard Global
Ozone Chemistry Aerosol Radiation Transport.) In this movie,
the green patterns show plumes of large aerosol particles, red shows
plumes of small particles, and the brownish and whitish colors show
where large and small particles are intermingling. Driving this
model are data gathered from many sources, including human emissions
from fossil fuels, biomass burning emissions, and natural sources of
gases and particulates such as vegetation, oceans, and volcanoes,
and the meteorological data provided by NASA’s Data Assimilation
Office. (Animation by Reto Stockli, NASA Earth Observatory, based
upon GOCART Model data provided by Mian Chin, Georgia Tech and NASA
GSFC)
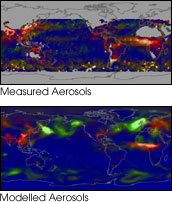
When comparing a movie
of MODIS’ actual aerosol observations to a movie produced by the
GOCART Model, NASA scientists find surprisingly good agreement
between these two sources of information. The top movie shows actual
MODIS measurements, while the bottom movie shows the GOCART
simulation. In both movies, the green patterns show plumes of large
aerosol particles, red shows plumes of small particles, and the
brownish and whitish colors show where large and small particles are
intermingling. Note that there are no areas of missing data in the
GOCART simulation, while the grey areas in the MODIS data show where
no measurements were made. Note also that the African continent
appears on both sides of the frame to illustrate how aerosol plumes
are transported across oceans and geopolitical boundaries alike.
(Animation by Reto Stockli, NASA Earth Observatory, based upon data
provided by the MODIS Atmosphere Science Team and GOCART Model data
provided by Mian Chin, NASA GSFC) |
